Evo 2 on GPUs other than the reference
This page explains why Evo 2 gives wrong results on some GPUs, how mmaemu restores its FP8 GEMMs, and what was measured. The runnable version is examples/evo2_blackwell.ipynb.
The problem
Evo 2 1B (evo2_1b_base) has 25 blocks. In 21 of them (the Hyena blocks
0-2, 4-9, 11-16 and 18-23) the input projection is an FP8 GEMM computed by Transformer Engine (TE): the
activations and the weight are cast to E4M3 with per-tensor scales, multiplied on the tensor cores with fast
accumulation, and returned in bf16. The four attention blocks (3, 10, 17, 24) have no FP8 GEMM. The model's
outputs depend on how the GPU computes those FP8 GEMMs:
- On an RTX 5070 Ti (Blackwell, sm_120) with TE 2.5.0, upstream issue #157 reports a loss of 1.248 on the upstream test where 0.502 is expected, and 1.365 with FP8 disabled.
- evo2 0.6.0 refuses to load the 1B model when TE is missing (only the 7B model has a bf16 fallback), and the upstream README lists FP8 through TE on a Hopper GPU as a requirement for the 1B, 20B and 40B checkpoints.
Replacing the FP8 GEMM by a bf16 GEMM with the original weights does not help: the loss is then 1.365, worse than the RTX 5070 Ti's native FP8.
What mmaemu changes
Each FP8 projection is replaced by a module that reproduces TE's computation on the GPU of an mmaemu profile. The
profile chooses whose Transformer Engine GEMM is reproduced: hopper-te, the H100 PCIe with TE's 32 MiB cuBLAS
workspace, or ada-te, the RTX 4060 with TE's 4 MiB workspace. The notebook uses ada-te, because its reference
outputs were recorded on the RTX 4060 (below);
examples/evo2_offload.py takes --profile hopper-te (the default) or --profile ada-te.
- The FP8 scales are read from the checkpoint: TE stores them in
blocks.N.projections._extra_state(scale_fwd[:2]: input, weight). - Input and weight are cast to E4M3 as TE does: multiply by the scale, saturate to +-448, cast.
- The GEMM is
mmaemu.scaled_mm(xq, wq.t(), 1 / scale_x, 1 / scale_w, out_dtype=torch.bfloat16,
   use_fast_accum=True, profile="hopper-te")
for the H100 PCIe,profile="ada-te"for the RTX 4060 (the notebook's). No Evo 2 projection shape splits in either profile's split-K table. - vortex pads the sequence length to a multiple of 16 on its TE path; the module does the same and drops the padding rows afterwards.
The model itself is the upstream one: vortex.model.model.StripedHyena built from evo2's own configuration with
use_fp8_input_projections=False (plain bf16 linear layers, which the patch then replaces), and loaded with
vortex's checkpoint loader. The whole patch is one notebook cell, tagged evo2-fp8-patch; it needs no TE.
The other operations of the model (bf16 matrix products, the Hyena convolutions, normalisations, attention) still run natively, so the full model is not bit-identical to the official run on the profile's GPU. The results below measure how close it is, against the distance between two GPUs that both run the official path.
Running the notebook
Requirements: an NVIDIA GPU with about 12 GB of free memory (the BRCA1 windows are 8,192 bp), Python 3.12,
torch 2.7.1 (CUDA 12.8), evo2 0.6.0, vtx 1.1.0, flash-attn 2.8.0.post2, mmaemu, and matplotlib, pandas,
scikit-learn, openpyxl, jupyter. Transformer Engine is not needed. Run it from examples/:
cd examples
jupyter nbconvert --to notebook --execute --inplace evo2_blackwell.ipynb   # or open it in Jupyter
| Variable | Default | Meaning |
|---|---|---|
EVO2_1B_CHECKPOINT |
downloaded from Hugging Face (arcinstitute/evo2_1b_base, 2.7 GB) |
a local evo2_1b_base.pt |
EVO2_BLACKWELL_OUT |
evo2_blackwell_outputs/ |
downloads, logits, scores and results.json |
EVO2_BLACKWELL_VARIANTS |
500 | BRCA1 variants to score (a prefix of the 500-variant subset) |
On the RTX 5070 Ti the whole notebook takes about half an hour, almost all of it BRCA1 scoring (about 15 minutes with mmaemu, 7 natively and 7 with bf16 projections).
The reference data
examples/data/evo2_1b_ada_rtx4060_te.npz holds the outputs of the official path on the RTX 4060 (evo2 0.6.0,
TE 2.3.0, driver 572.16), compact enough to ship (0.7 MB):
| Key | Content |
|---|---|
<w>/ids |
the token ids of window <w> (p0-p3, w8k, w2k) |
<w>/acgt |
the fp32 log-probabilities of A, C, G, T at every position (softmax over the 512-token vocabulary) |
<w>/next |
the fp32 log-probability of the true next token at every position |
brca1/rs, brca1/vs |
the scores of the 435 reference windows and 500 variant windows |
brca1/pos, brca1/ref, brca1/alt, brca1/lof |
the variants of the subset and their class |
examples/data/evo2_1b_ada_rtx4060_te.json describes the arrays and the run, and records the SHA-256 of the input,
weight and TE output of the first projection on the 2,048-bp window (from the hardware recording
evo2.evo2_1b_w2k) and the H100 baseline numbers. The scripts that captured these outputs, their logs and a check that the shipped
arrays equal the captures are in the RTX 4060 reference log.
Results on the RTX 5070 Ti
Measured with the notebook, profile ada-te, on an RTX 5070 Ti (70 SMs, 16 GB, WSL2), torch 2.7.1+cu128,
cuBLASLt 12.8.3.14, evo2 0.6.0, vtx 1.1.0, mmaemu 0.1.0.dev0 with kernel v4. Logs:
evo2-rtx-5070-ti
(this run) and
evo2-h100-sm90
(the official path on an H100 PCIe). The notebook ran again on the code of 0.1.0, after the profile rename, and
reported the same results apart from the timings (its BRCA1 passes took 15.7, 6.9 and 7.1 minutes), with the same
BRCA1 scores byte for byte
(log); the notebook in examples/ holds the
outputs of that run. The same GPU with the H100 PCIe profile hopper-te: below.
One GEMM
Block 0's projection on the 2,048-bp window (M 2048, N 5760, K 1920): with ada-te its bf16 output has the SHA-256
of the RTX 4060's TE output; natively, 8,293,802 of the 11,796,480 outputs (70.3%) differ, by up to 0.31. The
input and the weight are identical in both modes, so the difference is the GEMM alone. The same rows computed by
mmaemu on the CPU equal the GPU result bit for bit.
Six windows
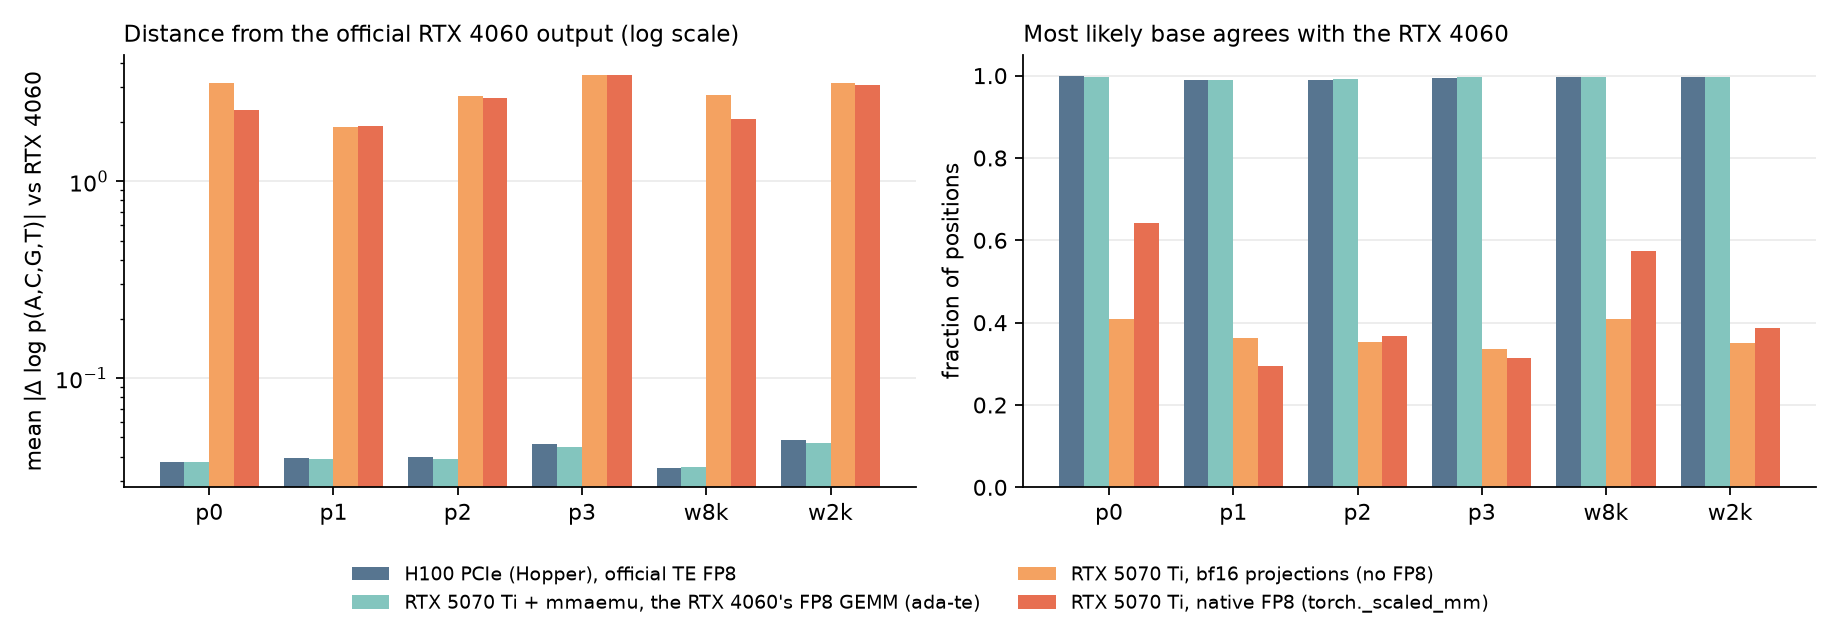
Mean |Δ log p(A,C,G,T)| against the RTX 4060
| Window | bp | H100 official | 5070 Ti + mmaemu (ada-te) |
5070 Ti native FP8 | 5070 Ti bf16 |
|---|---|---|---|---|---|
| p0 | 6,538 | 0.0375 | 0.0377 | 2.3062 | 3.1632 |
| p1 | 7,056 | 0.0391 | 0.0387 | 1.9133 | 1.8873 |
| p2 | 6,160 | 0.0399 | 0.0391 | 2.6397 | 2.7073 |
| p3 | 7,616 | 0.0464 | 0.0447 | 3.4576 | 3.4794 |
| w8k | 8,192 | 0.0351 | 0.0352 | 2.0656 | 2.7402 |
| w2k | 2,048 | 0.0485 | 0.0466 | 3.0922 | 3.1524 |
Most likely base agrees with the RTX 4060 (fraction of positions)
| Window | bp | H100 official | 5070 Ti + mmaemu (ada-te) |
5070 Ti native FP8 | 5070 Ti bf16 |
|---|---|---|---|---|---|
| p0 | 6,538 | 0.9982 | 0.9974 | 0.6418 | 0.4079 |
| p1 | 7,056 | 0.9894 | 0.9899 | 0.2954 | 0.3624 |
| p2 | 6,160 | 0.9904 | 0.9912 | 0.3680 | 0.3519 |
| p3 | 7,616 | 0.9947 | 0.9955 | 0.3136 | 0.3363 |
| w8k | 8,192 | 0.9957 | 0.9957 | 0.5743 | 0.4087 |
| w2k | 2,048 | 0.9961 | 0.9956 | 0.3877 | 0.3516 |
Mean next-token log-likelihood (the sequence score)
| Window | bp | RTX 4060 official | H100 official | 5070 Ti + mmaemu (ada-te) |
5070 Ti native FP8 | 5070 Ti bf16 |
|---|---|---|---|---|---|---|
| p0 | 6,538 | -0.2253 | -0.2253 | -0.2253 | -0.9051 | -1.3307 |
| p1 | 7,056 | -0.7801 | -0.7806 | -0.7803 | -1.3935 | -1.3719 |
| p2 | 6,160 | -0.5600 | -0.5603 | -0.5601 | -1.3312 | -1.3721 |
| p3 | 7,616 | -0.4443 | -0.4441 | -0.4443 | -1.3656 | -1.3820 |
| w8k | 8,192 | -0.3840 | -0.3842 | -0.3838 | -1.0072 | -1.3387 |
| w2k | 2,048 | -0.2010 | -0.2019 | -0.2027 | -1.3167 | -1.3463 |
Log-probabilities are taken from the softmax over the full 512-token vocabulary. The sequence score is what
evo2.score_sequences returns. The logits of all three RTX 5070 Ti modes were bit-identical between two runs of
the notebook.
The upstream test (evo2/test/test_evo2.py, prompts p0-p3), computed as the test computes it: cross entropy
in bf16 on the GPU, argmax accuracy. The RTX 4060 row is the fp32 value from the shipped log-probabilities.
| Run | Loss | Accuracy |
|---|---|---|
| expected by the upstream test | 0.502 | 0.7956 |
| RTX 4060, official TE FP8 | 0.5024 | |
RTX 5070 Ti + mmaemu (ada-te) |
0.5027 | 0.7960 |
| RTX 5070 Ti, native FP8 | 1.2480 | 0.3848 |
| RTX 5070 Ti, bf16 GEMMs | 1.3652 | 0.3262 |
| issue #157: RTX 5070 Ti, TE 2.5.0 FP8 | 1.248 | |
| issue #157: RTX 5070 Ti, FP8 disabled | 1.365 |
Computed in fp32 instead (device-independent; the H100 log's upstream_test.py), the losses are 0.5024 (RTX 4060),
0.5026 (H100), 0.5025 (mmaemu, ada-te), 1.2488 (native) and 1.3642 (bf16).
BRCA1
500 variants (111 loss of function), 435 reference windows; Δ is the variant's score minus its reference window's.
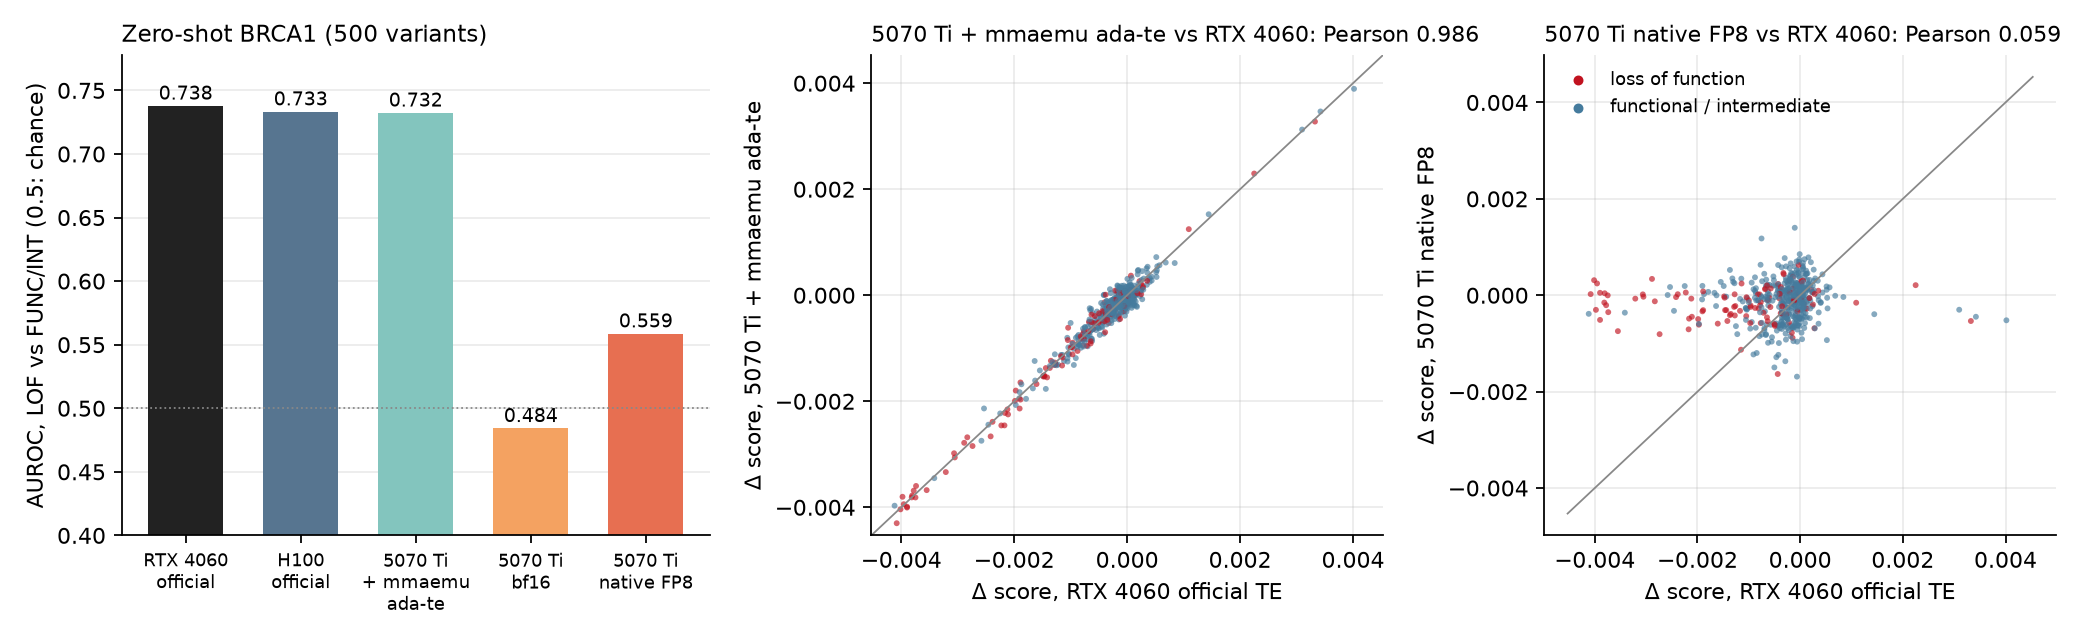
| Platform | AUROC | Δ Pearson vs RTX 4060 | Δ Spearman vs RTX 4060 | Δ same sign as RTX 4060 | Max |Δ sequence score| | Minutes |
|---|---|---|---|---|---|---|
| RTX 4060, official TE FP8 | 0.7378 | 1 | 1 | 100% | 0 | |
| H100, official TE FP8 | 0.7332 | 0.987 | 0.922 | 84.2% | 0.0004 | 2.5 |
RTX 5070 Ti + mmaemu (ada-te) |
0.7323 | 0.986 | 0.912 | 84.0% | 0.0004 | 15.9 |
| RTX 5070 Ti, native FP8 | 0.5586 | 0.059 | 0.165 | 59.0% | 0.18 | 7.0 |
| RTX 5070 Ti, bf16 GEMMs | 0.4842 | 0.069 | 0.078 | 56.4% | 0.62 | 7.2 |
Minutes: one pass over the 935 windows with upstream score_sequences, in the run of 14 October (host timer; on the WSL2 host of the RTX 5070 Ti
time.perf_counter runs 6-10% fast, see performance.md; the H100 row is from the rented H100
host).
With mmaemu (ada-te), the RTX 5070 Ti reproduces the task nearly as well as a second official GPU does: AUROC
0.732 against 0.733 on the H100 (0.738 on the RTX 4060), and nearly the same agreement of the per-variant score
changes with the RTX 4060 (Pearson 0.986 against 0.987). Natively, its FP8 GEMMs leave the model barely above
chance on this task (AUROC 0.559), and with bf16 GEMMs it is at chance (0.484); the per-variant score changes no
longer track the official ones.
With the H100 PCIe profile
The same RTX 5070 Ti ran the 1B and the 40B with hopper-te (the H100 PCIe with TE's 32 MiB workspace), outside
the notebook: the upstream model runs one block at a time, as for the 40B (on the 1B its logits
equal, bit for bit, those of the model held on the GPU, on all seven windows run), and every projection runs on
mmaemu's CUDA kernel h4 with S = 1 from the H100 table. The projections return the bits of TE's GEMM on the H100
PCIe: for the 21 projections of one 1B window, captured on the H100 through TE and through torch, mmaemu reproduces
all 168 outputs bit for bit (h100-probe). The rest of the model
runs natively, so the whole model is not bit-identical to the H100's: its logits differ from the H100's on every
window. The 1B's results follow; the 40B's are in its section. Log:
evo2-h100-profile-rtx-5070-ti (16 Oct, mmaemu
fa0fd90; the run predates the renaming of the profiles and names this one hopper-h100pcie-te).
The upstream test (prompts p0-p3, mean):
| Run | Loss (bf16, as the test) | Loss (fp32) | Accuracy |
|---|---|---|---|
| expected by the upstream test | 0.502 | 0.7956 | |
| H100, official TE FP8 | 0.5022 | 0.5026 | 0.7953 |
| RTX 4060, official TE FP8 | 0.5024 | 0.7951 | |
RTX 5070 Ti + mmaemu (hopper-te) |
0.5022 | 0.5024 | 0.7961 |
RTX 5070 Ti + mmaemu (ada-te) |
0.5027 | 0.5025 | 0.7960 |
With hopper-te the test passes. Its bf16 loss, 0.5022, is the H100's value in bf16, on each prompt as on the mean;
in fp32 the two differ (0.5024 against 0.5026), as do the accuracies: the equal bf16 losses come from rounding each
prompt's loss to bf16, not from equal logits.
Six windows (p0-p3, w8k, w2k), against the RTX 4060's official outputs that the notebook ships (the repository holds no H100 log-probabilities of the 1B windows); mean over the windows, with the range:
| Run | Mean |Δ log p(A,C,G,T)| | Most likely base agrees | Max |Δ sequence score| |
|---|---|---|---|
| H100, official TE FP8 | 0.0411 (0.035-0.049) | 99.41% | 0.0009 |
RTX 5070 Ti + mmaemu (hopper-te) |
0.0407 (0.036-0.047) | 99.40% | 0.0019 |
RTX 5070 Ti + mmaemu (ada-te) |
0.0403 (0.035-0.047) | 99.42% | 0.0016 |
BRCA1 (the same 500 variants, 111 loss of function; 15.5 minutes with hopper-te, block by block). AUROC:
0.7354 with hopper-te (95% bootstrap interval 0.675-0.793), 0.7323 with ada-te, 0.7332 on the H100 and 0.7378
on the RTX 4060. Per variant:
| Runs compared | Δ Pearson | Δ Spearman | Δ same sign | Max |score difference| (935 windows) |
|---|---|---|---|---|
hopper-te and the H100 (official) |
0.988 | 0.929 | 86.0% | 0.00039 |
ada-te and the H100 (official) |
0.986 | 0.921 | 84.2% | 0.00038 |
hopper-te and the RTX 4060 (official) |
0.987 | 0.920 | 86.2% | 0.00037 |
ada-te and the RTX 4060 (official) |
0.986 | 0.912 | 84.0% | 0.00040 |
| the RTX 4060 and the H100 (both official) | 0.987 | 0.922 | 84.2% | 0.00042 |
With either profile the RTX 5070 Ti is about as far from each official GPU as the two official GPUs are from each
other. hopper-te agrees slightly better with the H100 on the per-variant score changes (Pearson 0.988 and
Spearman 0.929, against 0.986 and 0.921 with ada-te), but not on AUROC: the four AUROCs lie within 0.0055 of each
other, well inside the 95% interval of each, and ada-te's (0.7323) is nearer the H100's (0.7332) than
hopper-te's (0.7354).
How to read these results
- The FP8 GEMMs are reproduced exactly. Each emulated projection returns the bits of the profile's GPU: the H100
PCIe's with
hopper-te(equal to the H100's captured outputs for the 21 projections of one 1B window, 168 of 168; no 40B projection was captured on an H100), the RTX 4060's withada-te; nothing else in the model is changed. - The model is reproduced about as closely as the official implementation reproduces itself. The official path on
an H100 differs from the RTX 4060 on more than half of the bf16 logits; with mmaemu the RTX 5070 Ti is at the
same distance with either profile (mean |Δ log p| 0.0407 with
hopper-teand 0.0403 withada-te, against 0.0411 for the H100; argmax agreement 99.4% for all three), while its native FP8 and bf16 GEMMs are about 65 and 70 times further away. End to end the two profiles differ little: with either, the whole model is about as far from the official H100 and RTX 4060 runs as these are from each other, and the two profiles are that far apart too (on the 40B at 2,048 bp: 0.0289 withhopper-teand 0.0295 withada-tefrom the H100, 0.0300 between the two official GPUs, 0.0299 between the two profiles). Because the rest of the model runs natively, neither profile brings the whole model much nearer its own GPU than the other does. - Task metrics are a weaker test than per-variant scores. The score changes of single-nucleotide variants are
tiny (mean |Δ| 6e-4 on the RTX 4060) and comparable to the differences between two GPUs (up to 4.5e-4 between the
official RTX 4060 and H100 runs), so even the two official runs agree on them only to Pearson 0.987 and Spearman
0.922, and their AUROCs differ by 0.005. Against the RTX 4060, mmaemu lands at the edge of that band with
hopper-te(Pearson 0.987, Spearman 0.920, same sign 86.2%) and just outside it on most BRCA1 measures withada-te(Pearson 0.986, Spearman 0.912, same sign 84.0%, largest score-change difference 4.8e-4); native FP8 and bf16 GEMMs fall far outside it. The AUROCs of the two official runs and of mmaemu with either profile lie within 0.0055 of each other and do not separate them. - Not covered: the 7B and 20B models were not run (the 7B's projection shape, (K, N) = (4096, 12288), splits
neither in the H100 PCIe's table nor on the RTX 4060 with the bf16 output Evo 2 uses, so
splitk="auto"resolves it); the 40B and the runs withhopper-teran outside the notebook (below, above); GPUs other than the RTX 5070 Ti were not run with the notebook; training and fine-tuning are out of scope (mmaemu is inference-only); and no projection had more than 8,192 rows. Every run fed one sequence at a time, of up to 8,192 bp, and up to that size every FP8 projection of the 1B and the 40B has a shape recorded in both profiles' split-K tables (S = 1,source='table'). Longer sequences, or several sequences batched into one projection (it flattens the batch into rows), were not run: there both profiles infer S = 1 from their envelope (underhopper-tea few sizes up to 16,384 are table rows, also S = 1), andhopper-te's envelope inferences warn (UnvalidatedEnvelopeWarning), because the H100 envelope failed its held-out test at TE's 32 MiB workspace.
Evo 2 40B
The BioNeMo Evo 2 documentation
describes the original 40B checkpoint (evo2_40b, 82 GB) as sensitive to Hopper's FP8 arithmetic, reports a much
higher loss for it with FP8 on a Blackwell GPU than on a Hopper GPU, and publishes a fine-tuned variant, with other
weights, for other GPUs. Here the original checkpoint ran on the RTX 5070 Ti (16 GB) with its 42 FP8 projections
computed by mmaemu in the same way as the 1B's, with each TE profile: hopper-te
(log) and ada-te
(log). Every projection shape, K 8192 and N 24576, is
unsplit in both profiles' split-K tables. No 40B projection was captured on an H100; the H100's GEMM was checked on
the 1B's projections (above). The weights stay in host RAM (82 GB resident) and the
upstream model runs one block at a time on the GPU (peak 11.2 GiB with ada-te, 10.9 GiB with hopper-te). The
scripts, checked on the 1B against the model held on the GPU (logits and BRCA1 scores bit for bit), and the ada-te
results are in the validation log; the hopper-te run
used a copy of these scripts with that profile added.
Upstream test (prompts p0-p3, mean):
| Run | Loss (bf16, as the test) | Loss (fp32) | Accuracy |
|---|---|---|---|
| expected by the upstream test | 0.2159 | 0.9167 | |
| H100, official TE FP8 (log) | 0.2159 | 0.2160 | 0.9167 |
RTX 5070 Ti + mmaemu (hopper-te) |
0.2161 | 0.2158 | 0.9164 |
RTX 5070 Ti + mmaemu (ada-te) |
0.2161 | 0.2158 | 0.9169 |
| RTX 5070 Ti, native FP8 | 1.4023 | 1.4048 | 0.2568 |
| RTX 5070 Ti, bf16 GEMMs | 1.4043 | 1.4057 | 0.2559 |
The upstream test passes within 1e-3 of the expected loss, which mmaemu meets with either profile (1.2e-4). With
hopper-te the bf16 loss equals the H100's on two of the four prompts, and no prompt's logits are the H100's. The
official path on an H100, run block by block in the same way, gives the expected loss to all seven of the test's
digits (0.2159424). Natively, with FP8 or bf16 GEMMs, the model predicts the next base about as often as guessing
would.
Against the official paths (the first 2,048 and 4,096 bp of the prompts' concatenation; the official 40B on the H100, and the upstream blocks with TE FP8 run one at a time on the RTX 4060, which on the 1B gives the real upstream model's logits bit for bit: log), mean |Δ log p(A,C,G,T)| and the share of positions where the most likely base agrees, at 2,048 / 4,096 bp:
| Run | Against the H100 | Most likely base agrees | Against the RTX 4060 | Most likely base agrees |
|---|---|---|---|---|
RTX 5070 Ti + mmaemu (hopper-te) |
0.0289 / 0.0283 | 100% / 99.98% | 0.0303 / 0.0297 | 99.90% / 99.93% |
RTX 5070 Ti + mmaemu (ada-te) |
0.0295 / 0.0288 | 100% / 99.93% | 0.0309 / 0.0285 | 99.90% / 99.93% |
| H100, official TE FP8 | 0.0300 / 0.0292 | 99.90% / 99.90% | ||
| RTX 5070 Ti, native FP8 | 3.97 / 4.07 | 23% / 24% | 3.97 / 4.07 | 23% / 24% |
On each of the six windows compared with the H100 by both profiles (these two and the four prompts), hopper-te
is slightly closer to it than ada-te; either is about as far from each official GPU as the two official GPUs are
from each other (for the 1B, against the RTX 4060: 0.0407 with hopper-te, 0.0403 with ada-te, 0.0411 for an H100).
BRCA1 (the first 100 variants of the notebook's subset of 500, 20 of them loss-of-function; logs:
hopper-te,
ada-te). AUROC with a
95% bootstrap interval, and the per-variant score changes Δ against the official 40B on the H100:
| Run | AUROC | Δ Pearson | Δ Spearman | Δ same sign |
|---|---|---|---|---|
| H100, official TE FP8 | 0.855 (0.745-0.940) | 1 | 1 | 100% |
RTX 5070 Ti + mmaemu (hopper-te) |
0.857 (0.749-0.940) | 0.9986 | 0.991 | 99% |
RTX 5070 Ti + mmaemu (ada-te) |
0.855 (0.751-0.934) | 0.9981 | 0.986 | 99% |
| RTX 5070 Ti, native FP8 | 0.503 (0.338-0.658) | 0.170 | 0.117 | 55% |
| RTX 5070 Ti, bf16 GEMMs | 0.590 (0.444-0.719) | 0.193 | 0.219 | 55% |
The 1B with the official path on the RTX 4060 gives 0.719 on these variants. With 20 loss-of-function variants the
AUROCs are rough and do not separate the profiles (ada-te gives the H100's 0.855, hopper-te 0.857), but per
variant the score changes of both follow the official 40B's closely, those of hopper-te slightly more so. On all
500 variants the official 40B on the H100 gives 0.868 (the 1B on the RTX 4060: 0.738).
Running Evo 2 40B
examples/evo2_offload.py is the method of the validation log as one command-line
tool. It takes any Evo 2 model (--model evo2_40b, evo2_20b, evo2_1b_base, ...); only the 1B and the 40B were
run. It needs what the notebook needs (evo2 0.6.0 with vtx and flash-attn, torch with CUDA, mmaemu; no Transformer
Engine) and host RAM for the checkpoint (82 GB for the 40B) plus 2 bytes x the hidden size (8,192 for the 40B) for
every token of the sequences run together. --ram-gb (default 32) caps the latter; more sequences run in several
passes. The 40B checkpoint is published in two parts:
hf download arcinstitute/evo2_40b --local-dir evo2_40b
cat evo2_40b/evo2_40b.pt.part0 evo2_40b/evo2_40b.pt.part1 > evo2_40b.pt
python examples/evo2_offload.py test --model evo2_40b --checkpoint evo2_40b.pt --out test.json
python examples/evo2_offload.py score --model evo2_40b --checkpoint evo2_40b.pt --input seqs.fasta --out scores.tsv
testruns the four prompts ofevo2/test/test_evo2.pyand prints each loss and accuracy, their mean and PASS or FAIL against the value the test expects (tolerance 1e-3; exit code 1 on FAIL).--outwrites them to a JSON file with the SHA-256 of each prompt's logits.scorereads a FASTA file (or one sequence per line) and writes a TSV of name, length and score: the mean log-probability of each next token, asevo2.scoring.score_sequencescomputes it (--reduce sum: the sum).--profile hopper-te(the default) or--profile ada-techooses whose TE GEMM the FP8 projections reproduce: the H100 PCIe's or the RTX 4060's.--fp8 nativeand--fp8 bf16run the same model with this GPU's own FP8 GEMMs or with bf16 GEMMs.
Checked against the scripts of the validation logs, on the RTX 5070 Ti with a 180 GiB host:
- with
hopper-te, after the profile rename (2648bba) (run_checks.out): on the 1B,testgives the same logits, losses and accuracies andscorethe same scores (40 BRCA1 windows), bit for bit, also withada-te; on the 40B,testgives the same logits and passes, in 7.6 minutes, loading included, with a peak resident set of 123 GiB (GNU time, test_40b_hopper-te.log); - with
ada-te, before the profile rename (run_checks.out): on the 1B the same, in all three modes (--fp8 mmaemu,nativeandbf16); on the 40B,testgives the same logits and passes, in 5.6 minutes, loading included, with a peak resident set of 157 GiB (GNU time, test_40b_mmaemu.log).
The resident sets count the pages of the memory-mapped checkpoint; hosts with less RAM were not tried.
Troubleshooting
- "Model 'evo2_1b_base' requires FP8 via Transformer Engine": you called
evo2.Evo2("evo2_1b_base")without TE. Build the model with the notebook'sload_evo2instead. UnsupportedFeatureError: mmaemu is inference-only: run the model undertorch.inference_mode(); the FP8 weight must be derived fromweight.detach().- vortex warns that flash-attn 2.8.0.post2 is outside its tested range: harmless here; the outputs above were produced with it.
- Out of memory on the BRCA1 cells: lower
EVO2_BLACKWELL_VARIANTS, or score the windows in smaller lists.