Performance
Emulating FP8 tensor-core arithmetic exactly costs far more than running it natively. This page says how mmaemu measures speed, what the kernels are expected to reach on the RTX 4060 and an RTX 5070 Ti, and where the measured release numbers are recorded.
Method
All GPU timings use CUDA events. Host timers are not used for kernel throughput: on the WSL2 reference host
time.perf_counter ran 6-10% fast against an external clock during the internal review of the prototype, which
biased every throughput computed from it. The kernel benchmark (tools/bench_kernels.py in the repository):
- checks every timed kernel bitwise before timing, per preset: the preset's IEEE kernel (v1 for
ada, h1 forhopper) against the CPU reference of that preset on the first min(M, 64) rows x 256 columns, every other kernel of the preset against that IEEE kernel on the full output (a mismatch stops the run and exits 1); - warms up for at least 1.5 s, then times windows of at least 1.0 s (sustained load: the RTX 4060 reaches its power limit and lowers its clock, so short bursts overstate throughput by 5-10%);
- samples the SM clock and power with
nvidia-smiand reports TMAC/s (10^12 multiply-accumulates per second) and MAC per clock per SM; - refuses to run when the host clock check (
tools/hostclock.py) reports a perf_counter drift above 0.2% and no CUDA events are in use; - requires each timed kernel to be loaded from a fatbin and records its image sha256 (the release numbers come from
the release fatbins in the package);
--allow-nvrtcadmits NVRTC builds, recorded as such and not used for thresholds.--v1-variantbuilds are bench-only nvcc cubins.
Release measurements on the RTX 4060 (T6)
T6 ran on 2026-10-14 on the profile device with the frozen release fatbins of da9edd4, loaded as users get them
(source fatbin; the image sha256 of every kernel equals the release manifest). The host and its software are
recorded in log:docs/validation_logs/2026-10-14/rtx4060-host/README.md, the reports in
log:docs/validation_logs/2026-10-14/t6-rtx-4060-sm89/README.md. Every timed kernel's output was first checked
bitwise against v1 (v1 against the CPU reference) at every M: 0 mismatches.
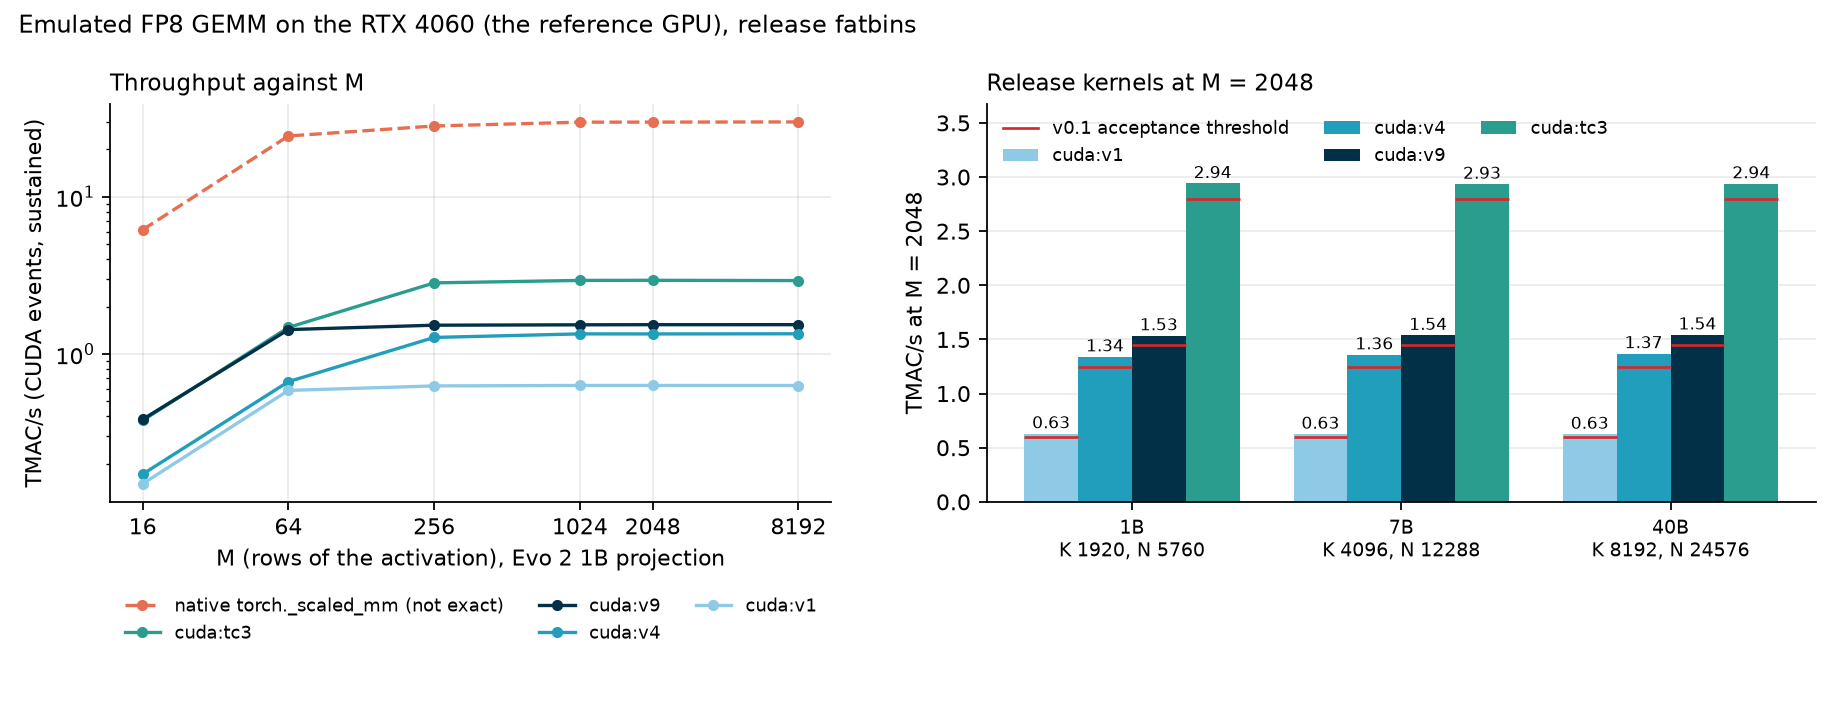
Sustained TMAC/s at M = 2048 for the Evo 2 shapes, Gaussian data (MAC per clock per SM in parentheses):
| Implementation | 1B (K 1920, N 5760) | 7B (K 4096, N 12288) | 40B (K 8192, N 24576) | v0.1 acceptance threshold | Audit (prototype, 1B) |
|---|---|---|---|---|---|
native torch._scaled_mm (fast accumulation; not exact) |
29.8 | 30.4 | 30.5 | (reference) | about 30-32 |
| tc3 (fp16 tensor-core "dummy accumulator", gated; sm_80/86/89 binaries) | 2.94 (49.0) | 2.93 (49.7) | 2.94 (50.1) | >= 2.8 | 2.94-3.02 |
| v9 (bf16 tensor cores for exponents, gated) | 1.53 (26.7) | 1.54 (27.2) | 1.54 (27.1) | >= 1.45 | 1.55-1.58 |
| v4 (CUDA cores, IEEE-defined instructions only; sm_80+) | 1.34 (22.3) | 1.36 (22.8) | 1.37 (23.2) | >= 1.25 | 1.30-1.38 |
| v1 (CUDA cores, IEEE-exact; sm_75+) | 0.63 (10.4) | 0.63 (10.4) | 0.63 (10.5) | >= 0.60 with the shared-memory decode table (shipped), else >= 0.48 | 0.51-0.53; about 0.66 with the shared-memory table |
| float64 reference, CPU (8 threads) | none | 116-181 MMAC/s |
- Every kernel is above its threshold on every shape. On the 1B shape tc3 (at the low end) and v4 lie inside the ranges an internal review measured for the prototypes; v9 is 1-3% and v1 about 5% below them. The shipped v1 is the DEC1 variant, which measured 0.636 on the same GPU in development (backends.md, "v1 variant decision").
- Native FP8 reaches 29.8-30.5 TMAC/s at M = 2048, about 500 MAC/clk/SM, as in the internal review on the recording host (30-32). From M = 256 on, the emulated GEMM with tc3 is about 10x slower than native (16-17x at M = 16 and 64 on the 1B shape; about 10x there on the 7B and 40B shapes). The test host's PCIe Gen3 x8 link does not enter: the operands stay on the GPU.
- In every kernel measurement the GPU runs at its 115 W power limit: the clock-event reason "SW power cap" appears in each, the SM clock averages 2.36-2.58 GHz at M >= 256, and the driver's power average is 109-115 W. The native runs record clocks but no power; the cap appears in 16 of their 18 measurements (not at M = 16 on the 1B shape nor at M = 64 on the 40B shape), and their clock at M >= 256 averages 2.40-2.63 GHz. MAC/clk/SM divides out the clock, so it is the figure to compare across hosts.
- The data does not change the speed: with the adversarial generator of the self-test, every kernel is within 1% of its Gaussian rate at every M and shape (ratios 0.990-1.006). The speed on real Evo 2 operands was not timed separately; their bits are checked by T3 (device independence: the full accumulators of all 21 Evo 2 1B projections, for every kernel).
Throughput against M, Evo 2 1B shape:
| M | tc3 | v9 | v4 | v1 | native | native / tc3 |
|---|---|---|---|---|---|---|
| 16 | 0.378 | 0.384 | 0.172 | 0.149 | 6.17 | 16x |
| 64 | 1.475 | 1.429 | 0.666 | 0.586 | 24.4 | 17x |
| 256 | 2.831 | 1.524 | 1.273 | 0.626 | 28.2 | 10x |
| 1024 | 2.936 | 1.532 | 1.341 | 0.630 | 29.8 | 10x |
| 2048 | 2.941 | 1.535 | 1.340 | 0.630 | 29.8 | 10x |
| 8192 | 2.928 | 1.535 | 1.343 | 0.630 | 29.9 | 10x |
Small M has too little parallel work for 24 SMs: at M = 16 every kernel runs at an eighth to a quarter of its
M = 2048 rate, and v9 is as fast as tc3 there (0.384 against 0.378 TMAC/s). AUTO does not depend on M and, for the
ada preset, selects tc3 at every size; from M = 256 on tc3 is about 1.9x faster than v9.
The hopper preset's kernels h4 and h1
h4 and h1 compute the hopper preset (the H100 profiles) with 32-product blocks: h4 with v4's design, h1 with v1's.
On an RTX 5070 Ti (sm_120, 70 SMs, SM clock 2,707 to 2,722 MHz), at M = 2048 with gauss40 data and the same method
as above, after the exactness gate (v1 and h1 bit for bit against the CPU reference of their preset, v4 against v1
and h4 against h1 on the full output):
| Shape (K x N) | h4 | h1 | v4 | v1 (TMAC/s) |
|---|---|---|---|---|
| Evo 2 1B (1920 x 5760) | 4.133 | 2.026 | 4.006 | 1.947 |
| Evo 2 7B (4096 x 12288) | 4.635 | 2.047 | 4.333 | 1.979 |
| Evo 2 40B (8192 x 24576) | 4.619 | 2.045 | 4.392 | 1.981 |
log:docs/validation_logs/2026-10-16/h4-rtx-5070-ti/README.md. h4 is 2.0 to 2.3 times as fast as h1 and 3 to 7%
faster than v4; h1 is as fast as v1.
On the RTX 4060 both were benched on fa0fd90 (and after the profile rename, within 0.01 TMAC/s:
log), outside T6: at M = 2048 with gauss40 data,
the method above, every kernel from the release fatbins, the median of 5 windows, after the same exactness gate
(log):
| Shape (K x N) | h4 | h1 | v4 | v1 (TMAC/s) |
|---|---|---|---|---|
| Evo 2 1B (1920 x 5760) | 1.35 | 0.69 | 1.35 | 0.63 |
| Evo 2 7B (4096 x 12288) | 1.41 | 0.69 | 1.37 | 0.63 |
| Evo 2 40B (8192 x 24576) | 1.41 | 0.69 | 1.37 | 0.63 |
h4 is about twice as fast as h1 there, as fast as v4 on the 1B shape and slightly faster on the 7B and 40B shapes; h1 is faster than v1. In the same run v1, v4, v9 and tc3 were within 1% of their T6 rates above.
Selection
With backend="auto", mmaemu uses the highest-priority kernel of the call's preset that loads and passes its gates on
the device: tc3 > v9 > v4 > v1 > reference for ada, h4 > h1 > reference for hopper. python -m mmaemu info shows the
status of each, with the reason when one is unavailable; python -m mmaemu selftest --force re-runs the gates.
What this means end to end
For Evo 2 1B on the RTX 4060 the internal review of the prototype measured the emulated FP8 projections as the dominant cost of an emulated forward pass with the prototype v1 kernel: about 95% of the extra time over native, and about 3.6x the native time in all (paired measurement). With tc3, about 10x slower than the native GEMM (T6 above), the emulated forward pass on the RTX 4060 is expected to take roughly 1.5-2x the native time. That is an estimate from the kernel rates; it was not measured.
The measured end-to-end figure is from the RTX 5070 Ti, where AUTO selects v4 for the profile the run used
(ada-te): an 8,192-bp Evo 2 1B forward pass takes about 1.0 s with mmaemu against 0.45 s natively (host
timer; evo2-rtx-5070-ti). It is a different GPU and
kernel from the estimate above.
On the CPU the float64 reference is practical for tests and single projections, not for whole models.